Since last post, and over the weekend, all CHS-gene sequences from all species have been annotated using BLAST. Additionally, MUMmer has been used to compare the largest contig with the published, assembled genome of P. infestans. Below are the results and some conclusions.
CHS-genes for all species
For all species, except S. parasitica, the best hits were sequences of length 572 and 333. This includes P. infestans as described in the previous post. The table below shows the top three hits for P. infestans, P. sojae, and P. ramorum.

The top three hits in BLAST for each species' CHS-gene sequence against the assembled genome of P. andina.
To conclude, the assembled genome of P. andina have contigs that match parts of the CHS-genes of all species, except S. parasitica. As the same sequence matches (as can be seen the longest matches are of exact same length), we have concluded that this sequence most likely is highly conserved between the species, but we cannot tell from these results from which species P. andina has specifically inherited this gene. We know P. andina is a hybrid between P. infestans and “other species”, and it is not too far fetched to assume that the “other species” could be all or some of these. However, we also cannot tell if P. andina is a hybrid with S. parasitica or not, just because they do not share this gene sequence.
In order to know more about the relatesness of P. andina to all of these species, we could instead of just comparing the largest contig from P. andina assembly with the genome of P. infestans, compare the largest contig to all species’ genomes. However, as of now, we do not know if these assembeld genomes exist and this is originally outside of the project’s scope. If more time was available, we discussed that one could compare all contigs of P. andina, individually with all other species’ genomes and investigate overall similarity.
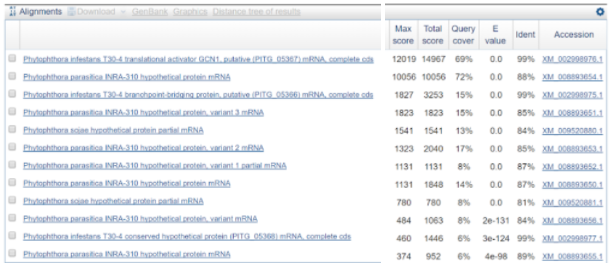
What we did was using BLAST against all for the largest contig. And the results can be seen in the figure below.
As seen here, P. infestans appears again, which is expected. However, seen is also a species called Phytophotora parasitica which was not included in the species we were asked to investigate. Therefore, it might be interesting to look into this species as well in the future.
Using MUMmer to compare sequences
In order to run MUMmer, the module was first added (it was already installed on UppMax). The goal was to compare the largest contig from our P. andina assembly with a relevant reference genome i.e. that of P. infestans as published in 2009.
Panos ran the following command:
mummer -mum -b -c AATU01.1.fasta contig1.fasta > comparison.mums
where:
-
AATU01.1.fastais the reference genome of P. infestans andcontig1.fastais our largest contig (notice that the format is now.fastaand not.fa, otherwise MUMmer won’t run) -
-mumcomputes MUMs, i.e. unique matches between the query (our contig) and the reference genome -
-bcomputes both forward and reverse complement matches -
-coutputs the query position of a reverse complement match relative to the forward strand of the same query sequence
The screenshot below shows a small part of the output.
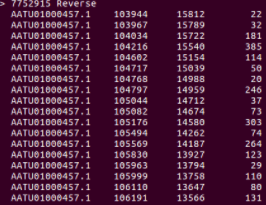
Output in the terminal after running MUMmer with the data and options as described above. For each hit, the columns represent the following from left to right: position in the reference sequence, position in the query sequence, and length of the match respectively.
In order to visualize the results, a plot was made.
mummerplot --postscript --prefix=ref_qry comparison.mums
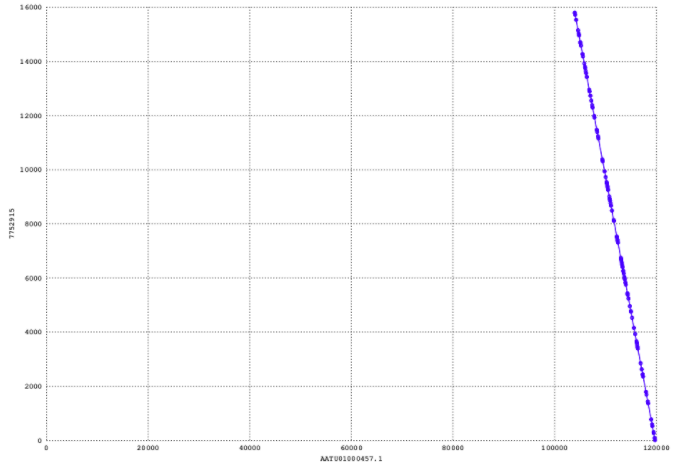
Where --postscript is the output format, --prefixis the first part of the output name, and comparison.mumsis the output file obtained from MUMmer. With this, we got three graphs. The output can be seen in the figure below.
The y-axis here refers to the query sequence, which is the largest contig, and the x-axis refers to the reference sequence. At this point, we have concluded that is is a reverse complemented match (which is also expected) and this can be seen from its orientation. However, I find it very hard at the moment to assess the quality.
What we also tried was adding 9 more contigs, so we used MUMmer for the 10 largest contigs. It generated the following plot.
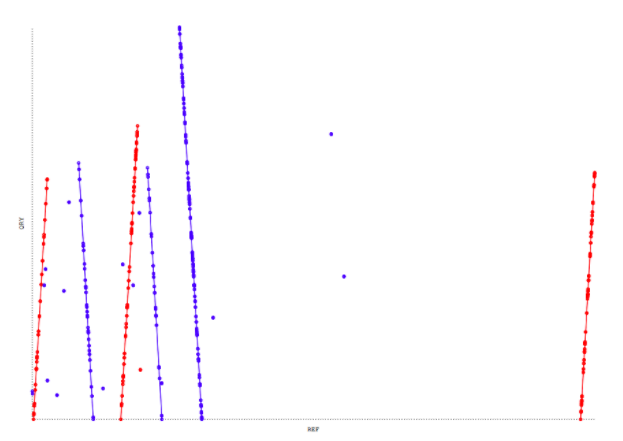
Dotplot with the 10 largest contigs against the reference genome. Only 6 contigs out of 10 have mapped.
In this figure, only 6 out of 10 contigs mapped to the reference sequence, with 3 of them mapping forward (red), and 3 mapping reverse (blue).
With the option -c, a coverage plot is obtained which illustrated the mapping of the contigs in a better way, although I would say we need more data for this to be useful, but I am not sure at the moment how this should look to be able to conclude valuable information from it.
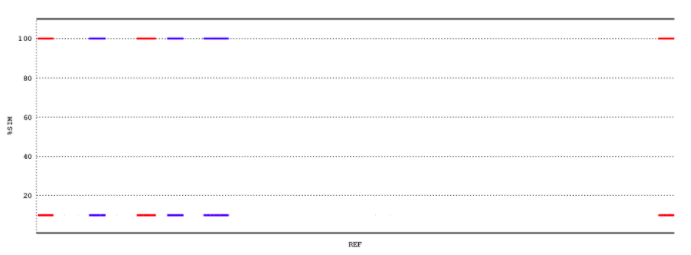
Coverage plot of the 10 largest contigs against the reference genome. From now on, the goal is to produce a similar graph but with more data.
What we aim to do now, is adding even more contigs to get more data for a coverage plot. I will extract at least 10 more contigs and Panos will run MUMmer again. Maria have started working on the content of the poster, and I have started creating a design to it.
